
Reporting Hub
Key Concepts
Reporting Hub is built on Looker. This page defines the key Looker terms used throughout the Reporting Hub documentation.
Preview — not yet released. This page previews an upcoming improvement to Reporting Hub. See the pre-announcement in the Release Notes for more detail about the change.
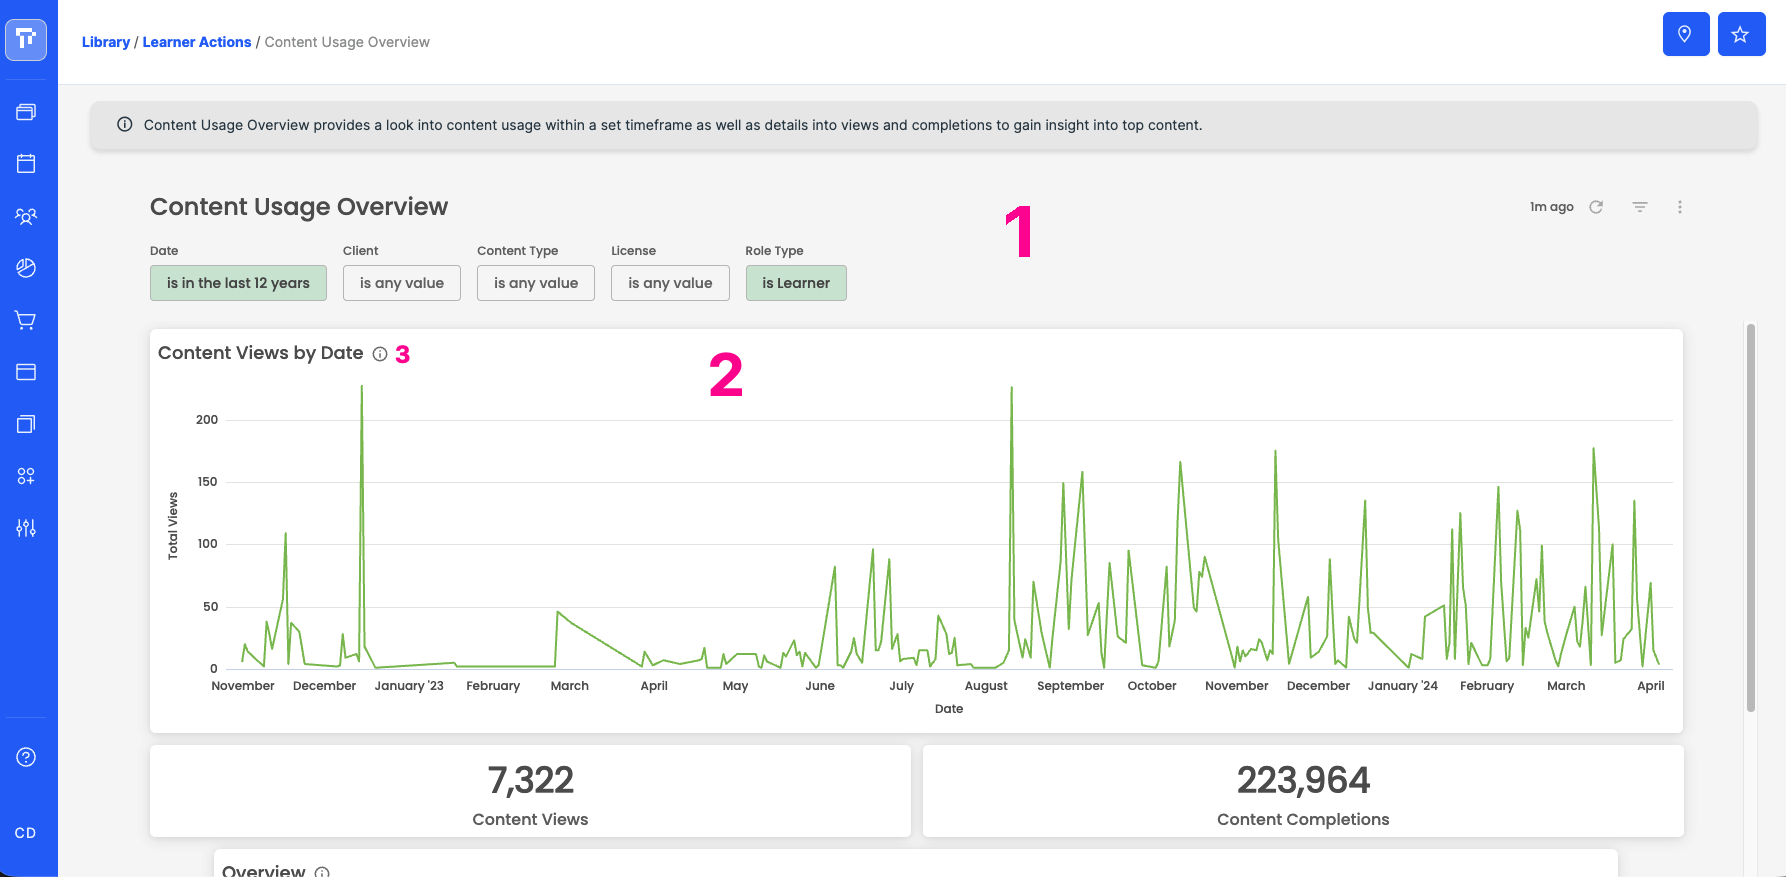
The numbered labels below point at the three elements defined on this page: the dashboard filter bar, a tile, and a tile's tooltip icon.
Dashboard
A dashboard (1) is a page in Reporting Hub that contains one or more tiles. Each dashboard is organized around a theme — for example, Content Usage Overview (shown above). The filter bar at the top of the dashboard lets you narrow results across all tiles on the page.
Tile
A tile is a single chart, metric, or data table on a dashboard (2). Each tile pulls data from one or more views and may apply its own filters. The screenshot above shows three tiles: a line chart ("Content Views by Date") and two metric tiles ("Content Views" and "Content Completions").
Tooltip
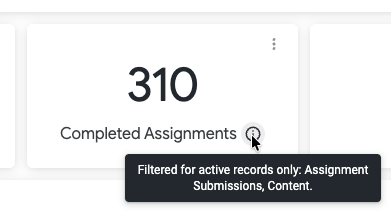
A tooltip is a small pop-up message that appears when you hover over the info icon (3) on a tile. Tooltips describe what filters are applied to that tile, including which views are filtered to active records only. The tooltip is not visible in the dashboard screenshot above — it only appears on hover.
View
In Looker, a view is the data object that a tile queries from. Each view maps to an underlying Redshift table or a derived table.
- A standard view maps directly to a Redshift table. For example, the
Learnersview maps to theuserstable in Redshift. - A derived table (also called a PDT, or Persistent Derived Table) is built from a custom query rather than mapping directly to a single Redshift table. Derived tables combine or transform data from one or more Redshift tables before presenting it as a view.
A single tile may pull from multiple views. For example, an enrollment tile might use the Learners, Content, and Learner Content Progress views together.
For a full list of available Redshift tables and their columns, see the NRT BI Connector table docs.
Custom Report
A custom report is a report you build yourself in Reporting Hub. Custom reports start with the same default filters as standard dashboard tiles, but you can modify or remove those filters to include inactive or deleted records.